LITESOPH Visualization Toolkit
LITESOPH Visualization Toolkit provides functionalities to plot and visualize simulation data. Current features include line plot, scatter plot, histogram and visualization of cube file(s) as movie rendered using blender.
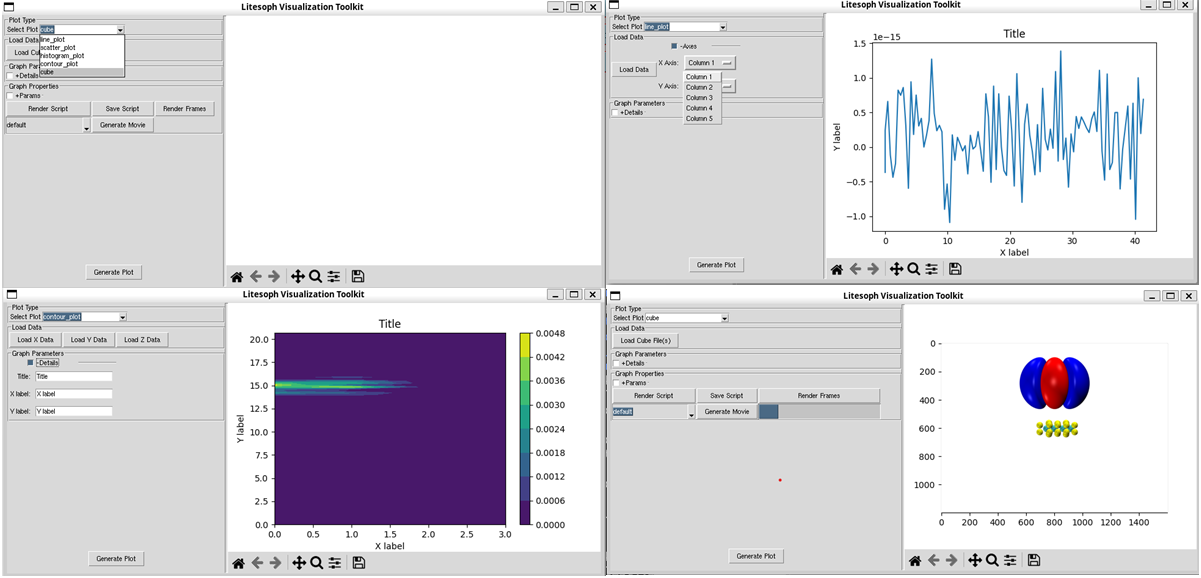
Usage
Go to LITESOPH Tools, then Visualization. LITESOPH Visualization Toolkit will popup.
Select Plot: Selection between types of plots.
if Selected Plot are Line Plot, Scatter Plot, Histogram Plot, then:
Load Data: load data (.dat file)
Axes: selection of x and y axes
if Selected Plot is Contour Plot, then:
Load X Data: load X axis data (.dat file)
Load Y Data: load Y axis data (.dat file)
Load Z Data: load Z axis data (.dat file)
if Selected Plot is Cube Plot, then:
Load Cube File(s): load one or many cube file(s) (.cube file)
Render Script: generates VMD tcl script for visualization
Save Script: edit and save generated script
Render Frames: generate each cube file frame for movie generation
Select Render Engine: selected render engine (default/blender)
Select Render Engine: render video from generated frames
Generate Plot: generate the final plot